

Similar to scheduling a yearly check-up with your doctor, it is essential to routinely evaluate the well-being of your business systems. Thankfully, NetSuite provides a variety of tools that enable users to proactively assess and enhance the efficiency and health of their NetSuite instances.
Performance Health Dashboard
Your first stop is the Performance Health Dashboard to identify any immediate issues within your NetSuite instance.
The Performance Health Dashboard is a powerful visual tool that once enabled, displays high-level information about your account over the previous 7 days using tiles, figures, and tables.
The dashboard includes key stats on areas including record pages, scripts, saved searches, integrations, and overall processors.
To start using the dashboard, go to Customization > Performance > Performance Health Dashboard.
On the dashboard, you may see one or more of the following types of issues:
- Error: Shows the number of issues related to high error rates.
- Performance Issue: Shows the number of problems related to slow or unusual processing times.
- Standards Update: Shows the number of issues related to NetSuite standard updates that you must address to keep your account running smoothly

Once you identify an issue or error, you can further investigate by clicking on each tile on the Performance Dashboard. You’ll see detailed tables for each issue type found in your account.
The dashboard will display issues based on your unique investigation.
You can use the “All Issues” subtab if there are multiple types of problems found in the account. NetSuite also offers additional dashboards and portlets to further dig into each NetSuite process, including the Record Pages Monitor, SuiteScript Analysis page, and
the Search Performance Analysis dashboard.

The below table shows what is included in each issue type.
| NetSuite Process | Issue Type | Issue | Description |
| Record Pages | Performance Issue |
High Median |
Alerts you to high median response time of record instances during the selected period. |
| Scripts | Error | High Error Rate | Alerts you to high error rate of script deployments during the selected period. |
| Standards Update | Deployments over 100 | Alerts you to the presence of scripts that exceed 100 deployments during the selected period. | |
| Saved Searches | Performance Issues | High Median Request Time |
Alerts you to high median time it took to execute the saved searches during the selected period. |
| High Timeout Rate | Alerts you to the high rate that saved searches timed out during the selected period. |
||
| Integrations | Error | High Error Rate | Alerts you to the high error rate of integrations during the selected period. |
| High Error Rate for Account Concurrency |
Alerts you to the high error rate because of requests that exceeded the account concurrency limit during the selected period. | ||
| High Error Rate for User Concurrency | Alerts you to the high error rate because of requests that exceeded the user concurrency limit during the selected period. | ||
| Performance Issue | High Median Time per Record | Alerts you to high median time it took for each record to execute during the selected period. | |
| Standards Update | Unsupported WSDL Version |
Shows integrations during the selected period that still use unsupported WSDL versions. | |
| Requests Near Concurrency Limit |
Measures how much of your integrations register requests near the concurrency limit during the selected period. | ||
| Processors | Performance Issue | High Average Wait Time |
Alerts you to high average wait time to complete jobs during the selected period. |
| High Rate of Failed Jobs |
Alerts you to the high rate of failed jobs during the selected period. | ||
| Low Usage of Reserved Processors |
Expresses the ratio of the instances when the processors reserved for high-priority jobs are at less than 50% for the selected period. |
Record Pages Monitor
If record pages are taking too long to load for you or customers, you can use the Record Pages Monitor tool to get precise details on response times, throughput, and more. The Record Pages Monitor provides detailed information on the 10 most used record operations.
You can enable the Record Pages Monitor by navigating to Customization > Performance > Record Pages Monitor. Once enabled, the Record Pages Monitor lets you view key metrics and trend graphs.
Like the Performance Health Dashboard, the Record Pages Monitor uses visual indicators and tiles to alert you to performance issues, which you can further investigate.
Each tile includes the following information:
1. Record Type
2. Record Operation
3. Average Response Time
4. Number of Users
5. Number of Instances
6. Response Time Trendline
When you click a tile, a set of charts associated with the record type and operation appear on the portlet. The system is designed to be responsive, letting you interact with the data visualizations to drill into further details.
For example, to get information on a specific data point, place your cursor over the corresponding item on the chart. Or, to view performance logs related to a specific data point by record type, click the relevant area on the chart to open the Page Time Summary page.
You can also zoom in on a key section on the chart or hide a segment of data by interacting with the chart legend.
The Record Pages Monitor offers four data visualization charts: Response Time Chart, Throughput Chart, User Event and Workflow Chart, and Execution Time Distribution Chart.
The Response Time Chart displays the median response time of record pages over time, to determine which pages are affecting end users. The graph shows Client, Network, and Server response times.

To identify peak periods, the Throughput Chart displays the number of record instances and number of users during a given interval. If a certain timeframe is regularly affected, consider running jobs outside peak times.

One of the most common reasons for performance bottlenecks is over-customization of the NetSuite instance. The User Event and Workflow Chart is designed to help you identify the impact of customisations on performance.

Occasionally, longer-than-expected response times may be due to one-time anomalies rather than larger performance issues. To see if this is the case, check the Execution Time Distribution Chart, which displays record instances grouped by response time.

SuiteScript Analysis
Is a script that was working well no longer keeping up with demand? You can use the SuiteScript Analysis tool to learn about when a script was installed and its performance.
To access the SuiteScript Analysis page, go to Customization > Performance > SuiteScript Analysis.
On the Page Time Details page, locate the SuiteScript and Workflow Details section and click the name of the script in the Name column.
SuiteScript Analysis offers two options for diving into script performance: the SuiteScript Details Portlet and the Performance Chart.
The SuiteScript Details portlet provides the details of the performance chart. This portlet includes metrics collected during script execution, such as the number of logs, URL requests, and record operations during the selected time range.
To see individual instances of the processed script and related summary data on SuiteScript Details, click View Logs.
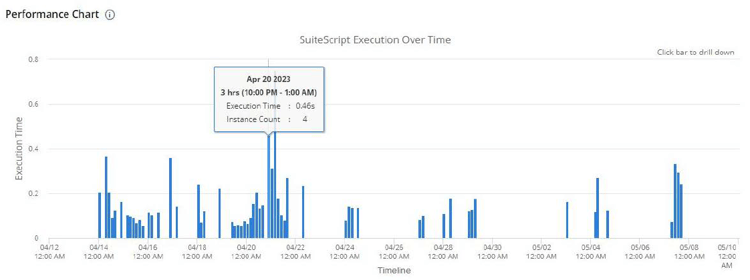
The Performance Chart displays aggregated SuiteScript execution over time. For precise details about average execution time, place your cursor over a bar on the chart.
The Performance Chart refreshes and displays the execution time values within a particular hour. In this example, higher response times occurred only between 1:10 p.m. and 1:15 p.m.
Search Performance Analysis Dashboard and Saved Search Portlet
NetSuite Saved Search, a top-used tool in NetSuite, provides real-time results that transform financial insights into data-rich stories. By monitoring saved searches in real time, you can ensure they operate at peak performance and identify potential performance issues.
In the Application Performance Management (APM) SuiteApp, NetSuite provides several tools for you to view and analyze the performance of your saved searches.
As with other performance tools, the Search Portlet uses tiles. The portlet displays the Top 10 saved searches based on your filters. Each tile contains the following information:
- Execution Time: Shows the median number of seconds it took for the saved search to execute within the specified period. This time includes only the retrieval of the saved search and excludes the retrieval of other page elements, such as filters, fields, or the UI.
- Timeout Rate: Shows the percentage of timeouts during saved search executions relative to the total requests within the specified period.
- Number of Users: Shows the total number of users who accessed the saved search within the specified period.
- Number of Requests: Shows the total number of requests for the saved search within the specified period.
- Execution Time Line Graph: Shows a line graph of the median execution time within the specified period.
You can update the duration of data presented using the dropdown list on the upper left corner of the page. If you need to access information within a custom timeframe, click the Saved Search tile. This action takes you to the Search Performance Details dashboard, where
you can filter data according to start date/time and end date/time.
If you need more details, the Search Performance Details dashboard provides you with more in-depth statistics about the performance of each saved search. The dashboard consists of two portlets and provides summary lists, charts, and logs about specific saved searches. It can be used for gathering data during performance reviews and critical investigations. You can filter data on the Search Performance Details dashboard by time/date or by using the saved search dropdown list.
The Saved Search Details portlet displays summary lists and four charts, which show performance statistics in detail. You can find the following charts on the portlet:
- Execution Time: Shows a line graph comparing the median execution times of saved searches over a specific period. This comparison includes only retrieval of the saved search and excludes retrieval of other page elements, such as filters, fields, or the UI.
- Requests: Shows a combination of bar and line chart that overlaps timeout counts with successful or failed status data over a specific period.
- Context: Shows a pie graph to display the proportion of contexts that used the saved search within the specified duration.
- Histogram: Shows a histogram comparing the total number of saved searches in various execution time intervals.
You can point to any value on the portlet’s charts to see a summary of data relevant to that chart.
Keep in mind that there are several proactive steps you can take to ensure your saved searches are optimized. They include scheduling saved searches, avoiding the
“Contains” condition, and filtering out inactive records

Putting It All Together to Maximise NetSuite Performance
Monitoring and optimising the performance of your NetSuite instance is crucial for ensuring efficiency and maximising productivity. By utilising tools like the Performance Health Dashboard, Record Pages Monitor, SuiteScript Analysis, and Search Performance Analysis, you can proactively identify and address performance issues to enhance user experience and streamline operations.
To take your NetSuite support to the next level and ensure your system is running at its best, don't hesitate to get in touch with our team of experts for personalised assistance and guidance.